


Introduction
Over the past 2 years, severe acute respiratory syndrome coronavirus 2 (SARS-CoV-2) has been rapidly spreading worldwide. It has led to more than 587 million confirmed cases of coronavirus disease 2019 (COVID-19) and 6.42 million deaths worldwide [1]. Currently, COVID-19 is considered a global pandemic. With the variant iteration of SARS-CoV-2 and the implementation of active epidemic prevention measures and vaccination in China, the incidence and mortality of severe and critical COVID-19 are at low levels [Reference Guo, Han, Zhang, He, Yu, Zhang, Wu, Zhang, Kong, Guo, Lin and Zhang2].
According to China’s current epidemic prevention policy, COVID-19 can spread rapidly throughout a region, not only having a substantial impact on public health and causing a shortage of medical resources but also affecting the efficiency of the government and utilizing people’s financial resources. Due to the differences in the data among regions, policies on the duration of inpatient and outpatient isolation for people with COVID-19 have been controversial. Knowledge of the duration of viral shedding (DVS) has significant implications for hospital infection prevention and control interventions, timely discharge management, and public health policies. Effective prediction of the PVS risk in patients with COVID-19 is critical for informing guidance around transmission-based isolation precautions. Recent studies indicated that PVS was associated with delirium incidence and six-month mortality in hospitalized COVID-19 patients [Reference Batra, Clark, Kang, Ali, Patel, Shlobin, Hoffman, Lim, Orban, Visvabharathy, Graham, Sullivan, Muller, Chou, Ungvári, Koralnik and Liotta3]. Therefore, the continuous detection of the dynamic manifestations of viral shedding in COVID-19 patients provides appropriate clinical data for predicting the clinical course or prognosis of hospitalized patients.
Studies have shown that male, elderly, overweight COVID-19 patients have prolonged DVS [Reference Zhang, Lin, Yang, Liu, Lu, Lu and Xue4, Reference Xu, Chen, Yuan, Yi, Ding, Wu, Li, Ni, Zou, Li, Xu, Zhang, Zhao, Zhang, Yu, Su, Lang, Liu, Wu, Guo, Tao, Shi, Yu, Cao, Ruan, Liu, Wang, Xu, Liu, Sheng and Li5]. Abnormal inflammatory indicators, such as interleukin-6 (IL-6) levels, C-reactive protein (CRP) levels, lactate dehydrogenase (LDH) levels, neutrophil count (NC), lymphocyte count (LC), and monocyte count (MC), are important factors for an extended DVS in COVID-19 patients [Reference Chen, Zhu, Hong, Zeng, He, Chen, Zheng, Qiu, Deng, Chan, Wang and Zhang6–Reference Coomes and Haghbayan8]. The neutrophil-lymphocyte ratio (NLR) is the ideal inflammatory marker, reflecting the systemic inflammatory response to disease [Reference Lin, Lin, Chuang, Tsai, Kuo, Chen and Hou9]. Mahat et al. [Reference Mahat, Panda, Rathore, Swain, Yadav and Sah10] performed a meta-analysis and showed that the NLR was significantly associated with the severity, length of stay, and prognosis of COVID-19 patients.
The Omicron variant has mutations in multiple sites, such as the spike protein, rendering a variety of neutralizing antibodies against SARS-CoV-2 ineffective or significantly less potent against this strain. The human debridement efficiency of the virus decreases, leading to a long-term infection state [Reference Guo, Han, Zhang, He, Yu, Zhang, Wu, Zhang, Kong, Guo, Lin and Zhang2]. Studies have shown that the Omicron variant has a 13-fold increase in viral infectivity and is 2.8-fold more infectious than the Delta variant [Reference Dong, Zhang, Ma, Tan, Chen, Liu, Xin and Zhuang11]. The Diagnosis and Treatment Protocol for COVID-19 (trial version 9) has corrected the boundary value of lifting isolation management and discharge standard cycle threshold (Ct) [12]. Bullard et al. [Reference Bullard, Dust, Funk, Strong, Alexander, Garnett, Boodman, Bello, Hedley, Schiffman, Doan, Bastien, Li, van Caeseele and Poliquin13] assessed the correlation of RNA Ct values with SARS-CoV-2 growth in cell culture. The data suggested that SARS-CoV-2 decreases infectivity when the Ct values are >24 and that each additional cycle with these Ct values reduces the odds ratio of restoring the virus by 32% in cell culture. La Scola et al. [Reference la Scola, le Bideau, Andreani, Hoang, Grimaldier, Colson, Gautret and Raoult14], assessing the correlation between SARS-CoV-2 isolation and real-time RNA Ct values in cell culture, found a significant relationship between Ct values and culture positivity. SARS-CoV-2 could not be isolated from any sample at a Ct value >34. Since February 2022, the COVID-19 epidemic has developed rapidly in Dongguan City, Guangdong Province, and the medical resources in the city have been significantly diminished. We realize that if medical personnel can effectively predict the PVS of COVID-19 patients, it could greatly improve the efficiency of medical resource use in medical institutions. Therefore, prediction models should be developed to predict PVS to help inform practical decisions related to infection control and public health policies.
Methods
Design and patients
In this study, 511 nonsevere COVID-19 patients hospitalized at the Ninth People’s Hospital of Dongguan City, Guangdong Province, China, from February 2022 to June 2022 were enrolled. The COVID-19 diagnostic criteria and clinical classification criteria of the Diagnosis and Treatment Protocol for COVID-19 (trial version 9) were used [12]. All subjects had a complete medical history and information about disease evolution. The following patients were excluded according to the exclusion criteria: severe or critical COVID-19 patients; COVID-19 patients receiving Paxlovid, remdesivir, or molnupiravir; COVID-19 patients receiving convalescent plasma and high-dose glucocorticoids; COVID-19 patients with a history of glucocorticoid use; COVID-19 patients who died during treatment; COVID-19 patients with malignancy, human immunodeficiency virus (HIV) infection, and severe renal and liver disease; COVID-19 patients who were pregnant or lactating; COVID-19 patients aged below 18 years; and COVID-19 patients who were not subjected to examination and treatment. Ultimately, 429 patients, including 337 patients with local onset, were included for model development and internal validation, and 92 patients of overseas origin were used for external validation of the model (Figure 1).

Figure 1. Patient screening and enrollment process.
Data collection
Clinical data were collected from the medical system of the Ninth People’s Hospital, Dongguan City, Guangdong Province, including demographic information, COVID-19 vaccination history, typical COVID-19 symptoms (fever, dry cough, fatigue, decreased olfactory taste, nasal congestion, runny nose, sore throat, conjunctivitis, myalgia and diarrhea), hypertension, diabetes, Ct value of viral RNA, DVS, biochemical indicators, and other laboratory indicators. According to the Diagnosis and Treatment Protocol for COVID-19 (Trial Version 9), we developed a relevant definition of virus clearance to measure the outcome and time to virus clearance in patients: (i) DVS—the time from the first day of a positive RT–PCR result to the second consecutive negative viral RNA test was the duration cutoff point; (ii) Early virus clearance (EVC)—a DVS ≤14 days; (iii) persistent virus shedding (PVS)—a DVS >14 days; (iv) initial time of virus shedding—the first day a positive RT–PCR result was received; (v) endpoint of viral shedding—the second of two consecutive RT–PCR tests was negative, with tests performed at least 24 hours apart; (vi) negative viral RNA results—viral RNA test of the N gene and ORF gene Ct values greater than or equal to 35; and (vii) positive viral RNA result—a positive viral RNA test indicating that the ORF gene and/or N gene Ct values were lower than 35. Viral RNA testing was performed at the Dongguan CDC using commercial kits (supplementary Material). The commercial kit supplier was Shanghai BioGerm Medical Technology Co., Ltd.
Statistical analysis
Data were fully anonymized before data cleaning and analyses. In this study, the transparent reporting of a multivariable prediction model for Individual Prognosis or Diagnosis (TRIPOD) guidelines were followed to develop, validate, and report multivariable prediction models. All data analyses were performed using IBM SPSS Statistics statistical software, version 24.0, and R language, version 4.0.1 (https://www.r-project.org). P < 0.05 was considered statistically significant. The sample size required for model development correlated with the number of candidate variables, the size of the total sample, and the proportion of outcome events [Reference van Smeden, Moons, de Groot, Collins, Altman, Eijkemans and Reitsma15]. In the early stage, we collected data from a small number of patients for statistical analysis. The incidence of an effective outcome was 40.0%, the mean absolute percentage error (MAPE) between the predicted outcome and the actual outcome was 0.07, the number of candidate predictor variables was 11, and the required sample size was at least 312 patients. The dataset developed in the present study included 337 patients, with an effective outcome incidence of 42.1%, and the corresponding number of effective outcomes per candidate predictor variable was 12.9. First, the data were cleaned, and Multiple Imputation by Chained Equations (MICE) was used to transform the dataset into complete data [Reference Royston16]. The baseline data of the overall study patients, local patients, and overseas patients were statistically described. Local patient data were divided into the viral early clearance group (EVC Group) and PVS Group by a DVS of 14 days and a DVS longer than 14 days. Descriptive data were calculated and are provided as frequencies, percentages, or medians with interquartile ranges (IQRs). Patient characteristics in the model development and validation cohorts were compared through nonparametric tests. Multicollinearity was possible by correlation coefficients between independent variables. If the variance inflation factor (VIF) exceeded 10, the multicollinearity was considered significant, and the independent variable with high multicollinearity was excluded. We used the call in the R language to the restricted cubic spline (RCS) in the “rms” package. A P nonlinear >0.05 suggested a linear relationship between the outcome and independent variables. The “MASS” and “glmmet” packages in the R language were used to screen the following 11 candidate variables using the LASSO algorithm: sex, age, body mass index (BMI), ORF gene Ct value, NLR, MC, CRP levels, IL-6 levels, ALB levels, LDH levels, and K+ levels. The model was constructed using multiple logistic regression by the “glm” package. The “PredictABEL” package was used to compare the advantages and disadvantages of the two model groups by the NRI and IDI. The calibration of the model was assessed by the C-statistic and the calibration curve. Decision curve analysis (DCA) was used to evaluate the net clinical benefit of the predictive model and was completed by the “ggDCA” package. The local patient data were used as the development dataset for the development model, and the prediction model was then internally verified by the self-service sampling method (boot = 1000). To assess the external validity of the model, overseas patient data were used as the validation set. The external validity of the model was assessed using the C-statistic, the calibration slope, and the calibration plot.
Results
Clinical characteristics of the patients
The development dataset included 337 patients of a native origin, and the validation set included 92 patients with an overseas origin. In the development dataset, the number of patients with PVS was 142 (42.1%), the median age was 37.0 years old (IQR: 29.0 to 50.0), and 143 patients were women (42.4%). The validation dataset included 92 patients, the number of patients with PVS was 36 (39.1%), the median age was 49.5 years old (IQR: 36.0 to 60.0), and the proportion of men (79.3%) was higher than that in the developed dataset (P < 0.001). Compared with the validation dataset, in the development dataset, fewer patients with hypertension (7.1% vs. 22.8%) and diabetes (4.5% vs. 16.3%) were present (P < 0.001). There were no differences in the time to admission, proportion of ACEI/ARB antihypertensive drugs used, number of vaccinations, BMI, NLR, and blood potassium levels between the development and validation datasets. From the baseline feature table, it can be seen that the mean age of the patients in the development dataset was younger, with a large female proportion and smaller proportions of combined hypertension and diabetes compared with the validation set. The patients included in the development dataset had lower Ct values and Cr and alanine aminotransferase (ALT) levels for the primary detection of SARS-CoV-2 RNA, higher ALB levels, and higher levels of the inflammatory markers CRP and IL-6 than those included in the validation set. Full data are shown in Tables 1 and 2.
Table 1. Clinical characteristics of the patients

ACEI, angiotensin converting enzyme inhibitor; ALB, albumin; ALT, alanine aminotransferase, ARB, angiotensin receptor blocker; AST, aspartate aminotransferase; BMI, body mass index; CK, creatine kinase; CK-MB, creatine kinase-MB; Cr, serum creatinine; CRP, C-reactive protein; IL-6, interleukin-6; LDH, lactate dehydrogenase; NLR, neutrophil-lymphocyte ratio; WBC, white blood cell.
Data are presented as the median (IQR) or n (%). P values were calculated using Wilcoxon’s rank-sum test, the χ2 test, or Fisher’s exact test.
Table 2. Differences in demographics between COVID-19 patients with a duration of viral shedding ≤14 days and > 14 days in the developmental and validation datasets

ACEI, angiotensin converting enzyme inhibitor; ALB, albumin; ALT, alanine aminotransferase; ARB, angiotensin receptor blocker; AST, aspartate aminotransferase; BMI, body mass index; CK, creatine kinase; CK-MB, creatine kinase-MB; Cr, serum creatinine; CRP, C-reactive protein; DVS, duration of viral shedding; LDH, lactate dehydrogenase; IL-6, interleukin-6; NLR, neutrophil-lymphocyte ratio; WBC, white blood cell.
Data are presented as the median (IQR) or n (%). P values were calculated using Wilcoxon’s rank-sum test, the χ2 test, or Fisher’s exact test.
Model development
In the development dataset, 11 candidate variables were screened using the AIC and LASSO algorithms. The AIC screen identified seven candidate variables: sex, CRP levels, IL-6 levels, NLR, MC, ALB levels, and K+ levels. The LASSO algorithm (λ = “lambda.1se”) screen identified 9 candidate variables: age, sex, Ct value of the ORF gene, CRP levels, IL-6 levels, NLR, MC, ALB levels, and K+ levels. The above two models, Model 1 and Model 2, were fitted. We compared the performance of the two models using the NRI, IDI, C-statistic, Brier score, ROC curve, and AIC (Table 3). The NRI was 0.19% (95% CI: −0.061, 0.065), indicating that the accuracy of Model 2 fitted with 9 variables in distinguishing PVS was 0.19% higher than that of Model 1. The IDI was 0.61% (95% CI: −0.002, 0.014), indicating that the predictive power of Model 2 was 0.61% higher than that of Model 1. ROC (0.766 vs. 0.771, P = 0.346) and AIC (301.94 vs. 398.24) analyses were performed by the roc.test function and AIC function (Table 3). The above results showed that the number of predictor variables of Model 1 was less than that of Model 2 while maintaining good discrimination and accuracy. Therefore, sex, CRP levels, IL-6 levels, NLR, MC, ALB levels, and K+ levels were ultimately determined to be the predictive model variables in Model 1 (Table 4). The ROC curve of the model showed excellent discrimination (C-statistic = 0.766, Brier score = 0.192) and good calibration (slope = 1) (Figure 2). The DCA plot indicated a good clinical net benefit in patients with PVS as predicted using Model 1 (Figure 3). The probability of predicting PVS occurrence in COVID-19 patients is presented as a nomogram (Figure 4a). A nomogram is a two-dimensional graphical tool that can be used to predict the probability of results, consisting of several lines arranged in scale. It shows a great advantage in simply and intuitively quantifying the risk of clinical events. The predictive model developed by our study renders specific risk prediction variables visualized through nomograms. For the final model, the probability of a DVS of >14 days in COVID-19 patients is presented as a nomogram. For example, a 46-year-old female patient with an NLR of 0.86, a CRP level of 4.4 mg/L, an IL-6 level of 5.53 μg/mL, an ALB level of 40.4 g/L, a K+ level of 3.5 mmol/L, and an MC of 0.48 × 10⁹/L had a total score of 319. The probability of a viral shedding duration >14 days in this patient was 69.3% (Figure 5).
Table 3. Model 1 for the odds ratios and beta coefficients in the development dataset

AIC, Akaike information criterion; ROC curve, receiver operating characteristic curve.
Table 4. Model 1 for the odds ratios and beta coefficients in the development dataset

ALB, albumin; CRP, C-reactive protein; IL-6, interleukin-6; MC, monocyte count; NLR, neutrophil-lymphocyte ratio.

Figure 2. Receiver operating characteristic (ROC) curve of Model 1 (C-statistic = 0.766, Brier score = 0.192, slope = 1).
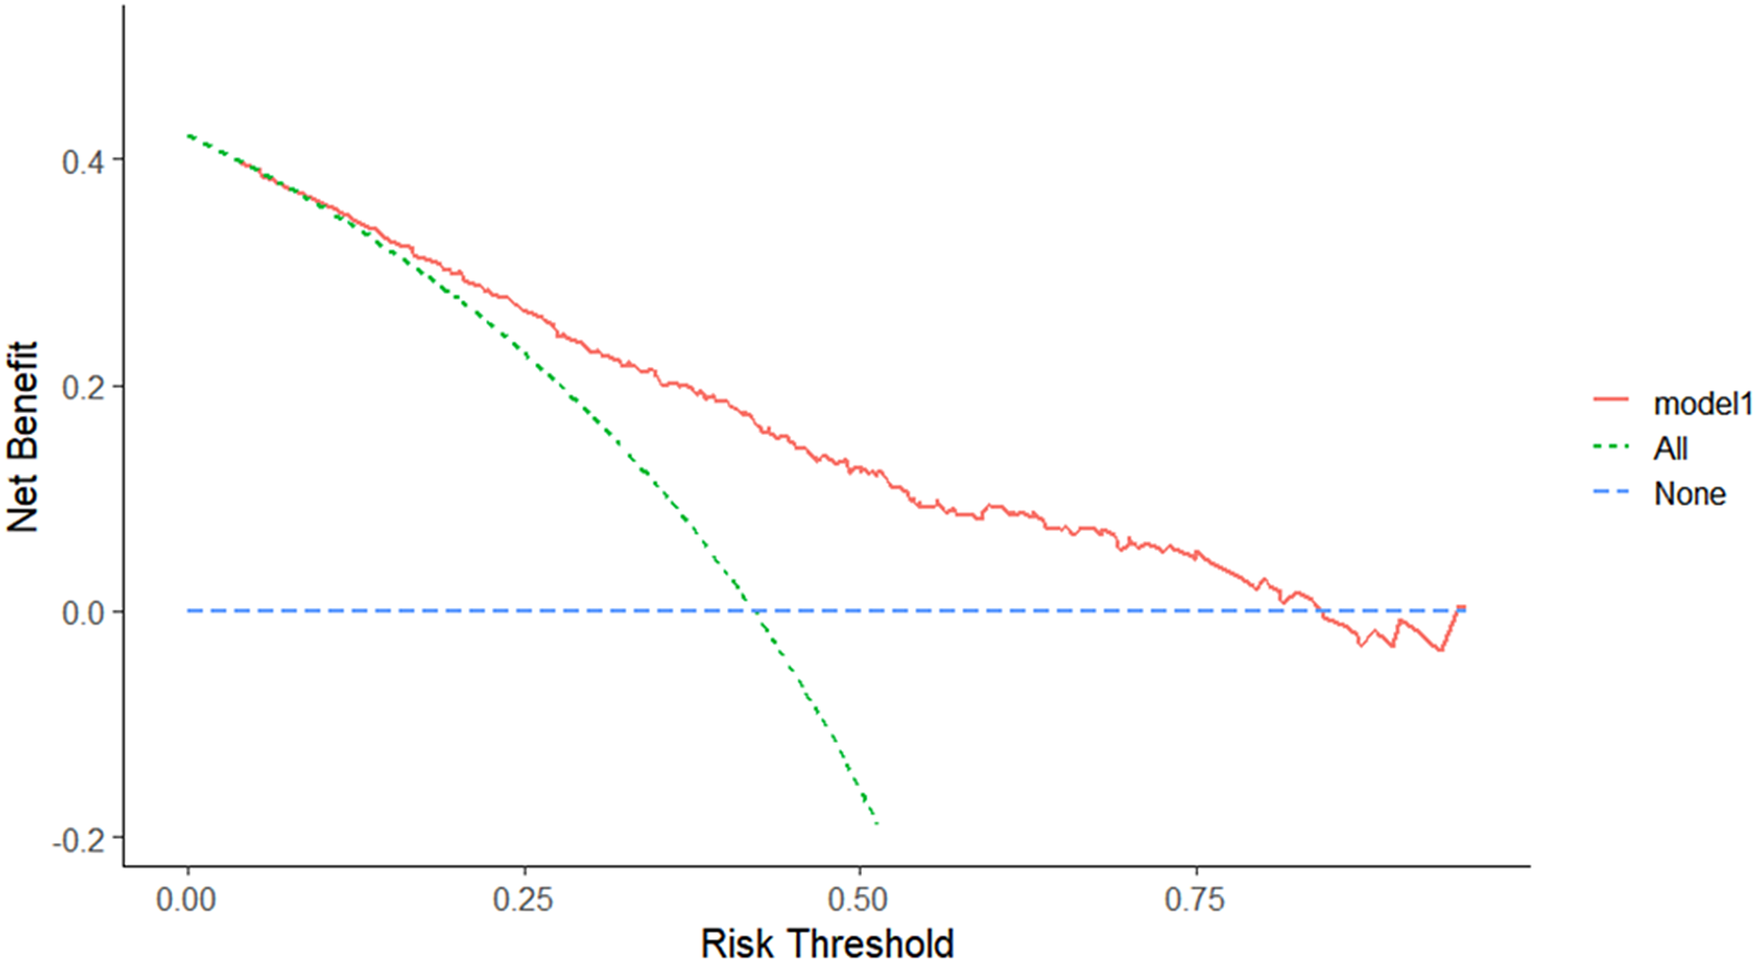
Figure 3. Decision curve analysis of Model 1. The DCA plot indicates a better clinical net benefit probability in patients with PVS as predicted using Model 1.

Figure 4. Nomogram of Model 1. Predicting the probability of the development of PVS in patients with COVID-19.

Figure 5. Risk prediction for individual patients. For example, a 46-year-old female patient with an NLR value of 0.86, a CRP level of 4.4 mg/L, an IL-6 level of 5.53 μg/mL, an ALB level of 40.4 g/L, a K+ level of 3.5 mmol/L, and an MC of 0.48 × 10⁹/L had a total score of 319. The probability of a DVS > 14 days in this patient was 69.3%.
Model validation
Internal validation was performed by the bootstrap method, showing that the model had a corrected C-statistic = 0.748, a corrected Brier score = 0.201, a corrected slope = 0.910, and a Hosmer–Lemeshow test P > 0.05 (Table 5 and Figure 6). Therefore, Model 1 was considered not poorly fit.
Table 5. Internal and external validation of Model 1


Figure 6. Calibration curve of Model 1 (corrected C-statistic = 0.748, corrected Brier score = 0.201, corrected slope = 0.910, Hosmer–Lemeshow test P > 0.05).
The external validation dataset included 92 overseas COVID-19 patients, of whom 36 (39.1%) had PVS. Model 1 performed well in the external validation dataset, with a C-statistic = 0.845, a Brier score = 0.155, and a slope = 1 (Table 5 and Figure 7). The model was verified by the bootstrap method to have a corrected C-statistic = 0.793, a corrected Brier score = 0.190, and a corrected slope = 0.672. Model 1 overestimated individual PVS at a probability of less than 30% and underestimated individual PVS at a probability greater than 30%.

Figure 7. Calibration curve for the external validation of Model 1. Model 1 performed well in the external validation dataset, with a C-statistic = 0.845, Brier score = 0.155, and slope = 1. It was verified by the bootstrap method with a corrected C-statistic = 0.793, corrected Brier score = 0.190, and corrected slope = 0.672.
Discussion
There have been very few clinical prediction model studies of clinical characteristics and DVS. In our study, the median DVS for the development dataset was 13 days (IQR: 11 ~ 16). According to the study of the Guangdong Provincial Center for Disease Control and Prevention, the total median DVS time of COVID-19 patients in Guangdong Province is 17 days (IQR: 11–25) [Reference Xu, Xie, Li, Ji, Sun, Hu, Li and Fang17].
Many recent reports of COVID-19 have revealed that male patients have more severe symptoms and a longer DVS than female patients. Many epidemiological data and observations on COVID-19 at home and abroad share a common feature: men are more likely to show worse disease severity, mortality, and DVS than women [Reference Fontana, Villamagna, Sikka and McGregor18]. In SARS-CoV-2 infection, the innate immune response is a major driver of viral clearance and pathogenesis. Women are considered to have a stronger immune system than men because they exhibit lower rates of infectious diseases and mortality and show a higher response to various types of vaccination than men [Reference Márquez, Chung, Marches, Rossi, Nehar-Belaid, Eroglu, Mellert, Kuchel, Banchereau and Ucar19]. Specific mechanisms might be related to the sex hormones that regulate immune function [Reference Giefing-Kröll, Berger, Lepperdinger and Grubeck-Loebenstein20].
ACE2 is considered the counterregulator of ACE. It mainly degrades angiotensin II (Ang II), which has vasoconstriction, cell proliferation, and proinflammatory effects, into angiotensin 1–7 (Ang 17), and it has vascular dilation, cell apoptosis, and anti-inflammatory effects. ACE2 is generally expressed in the cardiovascular, respiratory, urinary, and digestive systems [Reference Harmer, Gilbert, Borman and Clark21]. SARS-CoV-2 enters host cells through ACE2 and causes host ACE2 expression downregulation and membrane ACE2 shedding. This change results in elevated RAAS activity. The host develops vasoconstriction, thrombosis, inflammation, and increased angiogenesis, triggering poor prognosis [Reference Jackson, Farzan, Chen and Choe22].
Electrolyte disorder is a relatively common clinical manifestation of hospitalized COVID-19 patients. ACE2 is highly expressed in kidney tissues, and SARS-CoV-2 infection causes ACE2 shedding or ACE2 internalization, altering the ratio between angiotensin II and angiotensin and enhancing RAAS activity, leading to increased water-sodium reabsorption, blood volume, and urinary potassium excretion, thereby increasing cardiac load and kidney injury [Reference Angeli, Zappa, Reboldi, Trapasso, Cavallini, Spanevello and Verdecchia23]. In the case of SARS-CoV-2 infection, the presenting gastrointestinal symptoms cause potassium transgastrointestinal loss secondary to anorexia with concurrent disease [Reference Cheung, Hung, Chan, Lung, Tso, Liu, Ng, Chu, Chung, Tam, Yip, Leung, Fung, Zhang, Lin, Cheng, Zhang, To, Chan, Yuen and Leung24]. Hypokalemia was found in 41% of COVID-19 patients admitted to the Tertiary Teaching Hospital of Modena (Italy) [Reference Alfano, Ferrari, Fontana, Perrone, Mori, Ascione, Magistroni, Venturi, Pederzoli, Margiotta, Romeo, Piccinini, Franceschi, Volpi, Faltoni, Ciusa, Bacca, Tutone, Raimondi, Menozzi, Franceschini, Cuomo, Orlando, Santoro, di Gaetano, Puzzolante, Carli, Bedini, Milic, Meschiari, Mussini, Cappelli and Guaraldi25].
SARS-CoV-2 induces a hyperactivated inflammatory response that mediates multiorgan damage. IL-6 is one of the most prominent proinflammatory cytokines identified during SARS-CoV-2 infection [Reference Potere, Batticciotto, Vecchié, Porreca, Cappelli, Abbate, Dentali and Bonaventura26]. Activation of the IL-6 pathway induces hepatocyte synthesis and the release of various acute-phase proteins, including CRP, and reduces synthesis from albumin [Reference Unver and McAllister27]. This result indicates that the proinflammatory effect of IL-6 has a substantial effect on DVS. CRP is an acute-phase inflammatory protein produced by the liver that is regulated at the transcriptional level by the cytokines IL-6 and IL-1. It is an important indicator for the diagnosis and assessment of severe pulmonary infectious diseases [Reference Black, Kushner and Samols28]. In a meta-analysis, elevated IL-6 levels, CRP levels, and NLR values were associated with severity and mortality in COVID-19 patients [Reference Mahat, Panda, Rathore, Swain, Yadav and Sah10].
ALB levels are associated with prognosis and DVS in COVID-19 patients. ALB levels were an independent risk factor in the study [Reference Cogliati Dezza, Oliva, Cancelli, Savelloni, Valeri, Mauro, Calabretto, Russo, Venditti, Turriziani and Mastroianni29, Reference Violi, Ceccarelli, Cangemi, Alessandri, D’Ettorre, Oliva, Pastori, Loffredo, Pignatelli, Ruberto, Venditti, Pugliese and Mastroianni30]. Currently, it is speculated that the negative correlation between ALB levels and DVS might be related to the acute inflammatory response, acute kidney injury, thrombosis, and the downregulation of ACE2.
Neutrophils (NEUs) are a major component of leukocyte cell populations that can be activated and migrate from the venous system to the immune organs or systems. NEUs release large amounts of reactive oxygen species that induce cellular DNA damage and release the virus from the cells. Furthermore, NEUs can be triggered by the virus-associated inflammatory factors IL-6 and TNF-α and granulocyte colony-stimulating factors produced by lymphocytes, endothelial cells, and interferons [Reference Yang, Liu, Tao and Li31]. Conversely, the human immune response triggered by viral infection mainly depends on lymphocytes, and systemic inflammation significantly suppresses cellular immunity, thus significantly reducing CD4+ T lymphocytes and increasing CD8+ inhibitory T lymphocytes [Reference Wang, Zhu, Fu, Liu, Xiao and du32]. Lymphocytopenia in COVID-19 patients is mainly caused by CD4+ T lymphocyte depletion and is believed to be associated with a dysregulated immune response with more inflammatory responses [Reference Phares, Stohlman, Hwang, Min, Hinton and Bergmann33]. Ding et al. [Reference Ding, Yu, Lu, Huo, Chen, Kang, Lou and Liu34], in a retrospective study of 72 hospitalized COVID-19 patients, found significantly elevated leukocyte and NEU counts and a positive NLR value with an increased length of stay.
A nomogram is a two-dimensional graphical tool that can be used to predict the probability of an outcome, consisting of several lines arranged in scale. It demonstrates great superiority in simply and intuitively quantifying the risk of clinical events. A large amount of clinical data is derived for COVID-19 patients during hospitalization, but it is difficult for clinicians to pay full attention to these data. Therefore, we have provided a visual description of the prediction model to help clinicians easily understand the model’s prediction results and factors. The present study has several limitations. This was a retrospective study from a single center. Although we assigned local and overseas patients to different groups for comparison, the treatment scheme and isolation measures may limit the extrapolation of the research results. Although we used the bootstrap method and simplified model predictor variables to avoid overfitting, the sample size was relatively small, and there was still an inherent risk of overfitting. Our study only included patients with nonsevere COVID-19, so our results might not be generalizable to patients with severe COVID-19. Variables were removed due to more patients with missing data on the urinary leukocyte count, urinary red blood cell count, and urinary protein levels and the high collinearity of the N gene Ct values, NC, LC, and blood creatinine with other variables within the model. Therefore, the predictive model developed in this study could not be absolutely applicable for prognostic evaluation using the excluded variables. Despite these limitations, the model developed in this study showed excellent discrimination and calibration. A simple and easy-to-use nomogram could enable most clinicians to easily predict the prognosis of patients with COVID-19.
Conclusion
The predictive model developed in this study could efficiently and accurately calculate the probability of a DVS > 14 days by easily accessible laboratory examination results. It could contribute to saving limited medical resources and optimizing quarantine policies and treatment options in the future.
Supplementary material
The supplementary material for this article can be found at https://doi.org/10.1017/S0950268823000717.
Data availability statement
The data supporting the findings of this study are available from the Ninth People’s Hospital of Dongguan. Restrictions apply to the availability of these data, which were used under license for this study. Data are available from the corresponding author with the permission of the Ninth People’s Hospital of Dongguan.
Acknowledgements
We thank the Ninth People’s Hospital of Dongguan and Binhaiwan Central Hospital of Dongguan for their support of this study.
Author contribution
All authors have reviewed and approved the final version of the manuscript and contributed significantly to the work. Conceptualization: ESL, QYZ, YTW, and JC. Data collection: XX and LZZ. Data analysis: ESL, QYZ, and JC. Project administration: YTW and JC. Supervision: QYZ and LZZ. Writing: ESL and LZZ.
Financial support
This research received no specific grants from any funding agency in the commercial or not-for-profit sector.
Competing interest
The authors declare none.
Ethical standard
The Ninth People’s Hospital, Dongguan City and Binhaiwan Central Hospital, Dongguan City approved the recollection of information.


 Open access